3QFY2019 Result Update | Footwear
February 13, 2019
Bata India
BUY
CMP
`1,189
Performance Update
Target Price
`1,479
Y/E March (` cr)
3QFY19
3QFY18
% yoy
2QFY19
% qoq
Investment Period
12 months
Net sales
779
674
15.5
673
15.7
EBITDA
164
111
47.3
87
88.0
Stock Info
EBITDA margin (%)
Sector
Footwear
21.1
16.5
455bp
13.0
811bp
Market Cap (Rs cr)
15,281
Adjusted PAT
104
68
52.2
56
86.4
Net Debt
(591)
Source: Company, Angel Research
Beta
0.9
For 3QFY2019, Bata India (BIL) posted strong set of numbers, exceeding our
52 Week High / Low
1,216/678
expectations on bottom-line front. Revenue grew by ~16% yoy (in-line with our
Avg. Daily Volume
46,557
Face Value (Rs)
5
estimate). The company’s operating margins improved by robust 455bps yoy. On
BSE Sensex
36,154
the bottom-line front, BIL reported growth of ~52% yoy to `104cr on the back of
Nifty
10,831
strong operating performance.
Reuters Code
BATA.BO
Healthy volume growth drives top-line: BIL’s top-line grew by ~16% yoy to
Bloomberg Code
BATA.IN
`779cr on the back of healthy growth in footwear segment. The growth was
mainly due to successful brand refreshment of various product categories
Shareholding Pattern (%)
including the Power Walking Collection with Memory Foam, new styles in the
Promoters
53.0
fashionable Red Label collection, contemporary marriage collection by Hush
MF / Banks / Indian Fls
22.4
FII / NRIs / OCBs
10.8
Puppies, which in turn gave a boost to festive season sales. The brand also
Indian Public / Others
13.9
launched Bubblegummer and Power stores in Bengaluru and Indore respectively.
In Q3FY2019, Bata introduced Bollywood actor Sushant Singh Rajput as its new
Abs. (%)
3m 1yr
3yr
face for the Men's casual collection.
Sensex
4.5
6.1
58.6
Strong operating performance aids profitability: On the operating front, the
BIL
15.5
65.8
146.9
company reported better margins, up 455bps yoy at 21.1%. On the bottom-line
front, BIL reported growth of ~52% yoy to `104cr on the back of strong operating
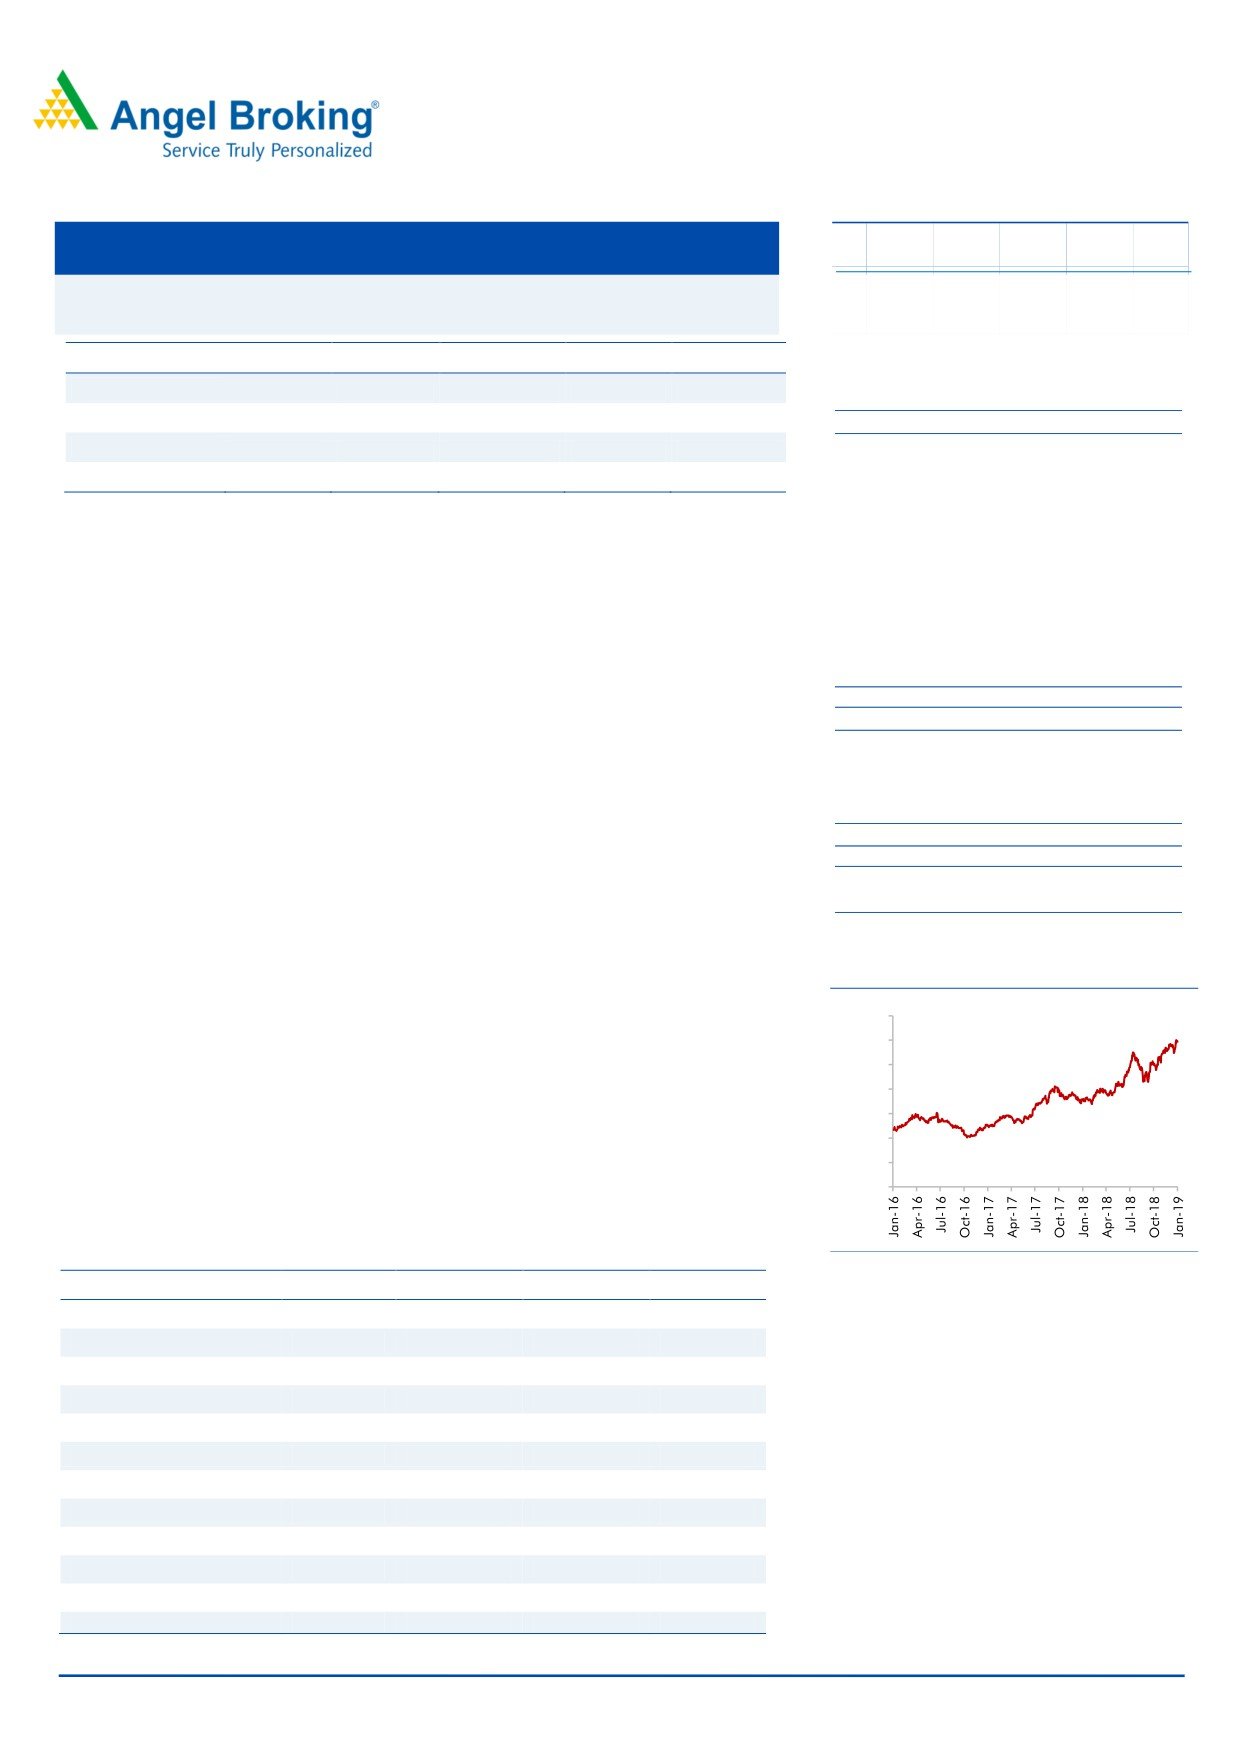
Historical share price chart
performance and healthy top-line growth.
1,400
Outlook and Valuation: We expect BIL to report net revenue CAGR of ~15% to
1,200
~`3,497cr over FY2018-20E mainly due to increasing brand consciousness
1,000
among Indian consumers, new product launches, higher number of store
800
additions in tier II/ III cities and focus on high growth women’s segment. Further,
600
on the bottom-line front, we expect CAGR of ~28% to `358cr over the same
400
period on the back of margin improvement (increasing premium product sales).
200
Thus, we maintain our Buy recommendation on Bata India with Target Price of
0
`1,479.
Key Financials
Source: Company, Angel Research
Y/E March (` cr)
FY2017
FY2018
FY2019E
FY2020E
Net sales
2,474
2,634
3,008
3,497
% chg
2.1
6.5
14.2
16.3
Adj. Net profit
173
221
306
358
Research Analyst
% chg
3.9
27.7
38.5
17.2
Amarjeet S Maurya
EBITDA margin (%)
10.4
13.3
16.2
16.4
022-40003600 Ext: 6831
EPS (`)
13.4
17.2
23.8
27.9
P/E (x)
88.0
68.9
49.7
42.4
P/BV (x)
11.5
10.2
8.7
7.5
RoE (%)
13.0
14.8
17.5
17.6
RoCE (%)
14.5
19.5
24.1
24.3
EV/Sales (x)
5.9
5.5
4.8
4.1
EV/EBITDA (x)
57.1
41.6
29.6
25.0
Source: Company, Angel Research Note
Please refer to important disclosures at the end of this report
1
Bata India Ltd| 3QFY2019 Result Update
Exhibit 1: 3QFY2019 Performance
Y/E March (` cr)
3QFY19
3QFY18
% yoy
2QFY19
% qoq
9MFY19
9MFY18
% chg
Net Sales
779
674
15.5
673
15.7
2249
2004
12.2
Consumption of RM
323
302.8
6.5
298
8.4
993
924
7.4
(% of Sales)
41.4
44.9
44.2
44.1
46.1
Staff Costs
83
69
19.7
81
2.7
246
214
14.8
(% of Sales)
10.7
10.3
12.0
10.9
10.7
Selling & Adm Expenses
97
90
8.2
94
2.7
282
273
3.6
(% of Sales)
12.5
13.3
14.0
12.6
13.6
Other Expenses
112
101
11.1
113
(0.8)
345
321
7.3
(% of Sales)
14.4
14.9
16.8
15.3
16.0
Total Expenditure
614
563
9.2
586
4.9
1,866
1,733
7.7
Operating Profit
164
111
47.3
87
88.0
383
272
41.0
OPM
21.1
16.5
13.0
17.0
13.5
Interest
1
1
85.6
1
(17.8)
3
2
36.9
Depreciation
17
15
10.5
15
11.0
47
44
8.8
Other Income
14
11
28.1
15
(7.7)
41
37
9.3
PBT (excl. Ext Items)
160
106
50.5
86
86.5
373
263
41.9
Ext (Income)/Expense
-
-
-
-
-
PBT (incl. Ext Items)
160
106
50.5
86
86.5
373
263
41.9
(% of Sales)
20.5
15.8
12.7
16.6
13.1
Provision for Taxation
56
38
47.5
30
86.8
132
91
44.0
(% of PBT)
35.1
35.9
35.1
35.3
34.8
Reported PAT
104
68
52.2
56
86.4
241.39
172
40.8
PATM
13.3
10.1
8.3
10.7
8.6
Minority Interest After NP
Reported PAT
104
68
52.2
56
86.4
241
172
40.8
Extra-ordinary Items
Adj PAT
104
68
52.2
56
86.4
241
172
40.8
Equity shares (cr)
13
13
13
13
13
FDEPS (`)
8.1
5.3
52.2
4.3
86.4
18.8
13.3
40.8
Source: Company, Angel Research
February 13, 2019
2
Bata India Ltd| 3QFY2019 Result Update
Outlook and Valuation
We expect BIL to report net revenue CAGR of ~15% to ~`3,497cr over FY2018-
20E mainly due to increasing brand consciousness among Indian consumers, new
product launches, higher number of store additions in tier II/ III cities and focus on
high growth women’s segment. Further, on the bottom-line front, we expect CAGR
of ~28% to `358cr over the same period on the back of margin improvement
(increasing premium product sales). Thus, we maintain our Buy recommendation
on Bata India with Target Price of `1,479.
Downside risks to our estimates
Store expansion from competitors like Khadim and Relaxo could impact the
company’s sales growth.
Slowdown in economy could hurt the overall profitability of the company.
Company Background
BATA India Ltd (BIL) is the largest footwear retailer in India, offering footwear and
accessories & bags across brands like Bata, Hush Puppies, Naturalizer, Power,
Marie Claire, Weinbrenner, North Star, Scholl, Bata Comfit and Bubblegummers.
Currently, the company’s ~70% revenue is derived from Men & Kids footwear
segment and balance from women’s segment. BIL retails in over 1,290 Bata stores
on bata.in and has thousands of multi-brand footwear dealer stores pan-India.
February 13, 2019
3
Bata India Ltd| 3QFY2019 Result Update
Profit & Loss Statement
Y/E March (` cr)
FY2016
FY2017
FY2018
FY2019E
FY2020E
Net Sales
2,423
2,474
2,634
3,008
3,497
% chg
(10.1)
2.1
6.5
14.2
16.3
Total Expenditure
2,147
2,217
2,283
2,520
2,924
Raw Material
1,152
1,158
1,202
1,323
1,539
Personnel
261
273
296
343
406
Selling & Adm
345
356
362
421
507
Others Expenses
389
430
423
433
472
EBITDA
276
257
351
488
574
% chg
(17.3)
(6.8)
36.8
38.9
17.6
(% of Net Sales)
11.4
10.4
13.3
16.2
16.4
Depreciation& Amortisation
79
65
60
69
79
EBIT
197
192
291
419
495
% chg
(22.5)
(2.6)
51.6
44.1
18.1
(% of Net Sales)
8.1
7.8
11.0
13.9
14.2
Interest & other Charges
2
4
4
4
4
Other Income
101
46
50
55
60
(% of PBT)
34.2
19.7
14.9
11.7
10.9
Recurring PBT
297
234
337
470
551
% chg
(9.8)
(21.1)
44.1
39.5
17.2
Tax
79
75
117
165
193
(% of PBT)
26.7
32.0
34.6
35.0
35.0
PAT (reported)
217
159
221
306
358
Extraordinary Items
51
(14)
-
-
-
ADJ. PAT
166
173
221
306
358
% chg
(20.5)
3.9
27.7
38.5
17.2
(% of Net Sales)
6.9
7.0
8.4
10.2
10.2
Basic EPS (`)
12.9
13.4
17.2
23.8
27.9
Fully Diluted EPS (`)
12.9
13.4
17.2
23.8
27.9
% chg
(20.5)
3.9
27.7
38.5
17.2
February 13, 2019
4
Bata India Ltd| 3QFY2019 Result Update
Balance Sheet
Y/E March (` cr)
FY2016
FY2017
FY2018
FY2019E FY2020E
SOURCES OF FUNDS
Equity Share Capital
64
64
64
64
64
Reserves& Surplus
1,157
1,260
1,429
1,651
1,916
Shareholders Funds
1,221
1,324
1,493
1,716
1,980
Total Loans
-
-
-
-
-
Deferred Tax Liability
-
-
-
-
-
Total Liabilities
1,221
1,324
1,493
1,716
1,980
APPLICATION OF FUNDS
Gross Block
382
406
508
578
678
Less: Acc. Depreciation
78
138
199
267
346
Net Block
304
268
309
311
332
Capital Work-in-Progress
19
30
-
-
-
Investments
-
-
-
-
-
Current Assets
1,321
1,525
1,680
1,975
2,322
Inventories
685
714
765
881
1,034
Sundry Debtors
71
69
89
107
134
Cash
342
522
591
704
812
Loans & Advances
59
57
61
78
98
Other Assets
163
163
174
204
245
Current liabilities
512
599
597
670
775
Net Current Assets
809
926
1,084
1,304
1,547
Deferred Tax Asset
89
100
100
100
100
Mis. Exp. not written off
-
-
-
-
-
Total Assets
1,221
1,324
1,493
1,716
1,980
February 13, 2019
5
Bata India Ltd| 3QFY2019 Result Update
Consolidated Cashflow Statement
Y/E March (` cr)
FY2016
FY2017
FY2018
FY2019E FY2020E
Profit before tax
297
234
337
470
551
Depreciation
79
65
60
69
79
Change in Working Capital
(41)
53
(88)
(105)
(135)
Interest / Dividend (Net)
(24)
(40)
4
4
4
Direct taxes paid
(108)
(65)
(117)
(165)
(193)
Others
1
10
0
0
0
Cash Flow from Operations
204
257
197
273
306
(Inc.)/ Dec. in Fixed Assets
(39)
(48)
(72)
(70)
(100)
(Inc.)/ Dec. in Investments
(75)
(181)
0
0
0
Cash Flow from Investing
(114)
(229)
(72)
(70)
(100)
Issue of Equity
0
0
0
0
0
Inc./(Dec.) in loans
0
0
0
0
0
Dividend Paid (Incl. Tax)
(42)
(45)
(51)
(58)
(64)
Interest / Dividend (Net)
85
197
(4)
(4)
(4)
Cash Flow from Financing
43
152
(56)
(62)
(68)
Inc./(Dec.) in Cash
132
180
69
141
137
Opening Cash balances
210
342
522
591
733
Closing Cash balances
342
522
591
733
870
February 13, 2019
6
Bata India Ltd| 3QFY2019 Result Update
Key Ratio
Y/E March
FY2016
FY2017
FY2018
FY2019E FY2020E
Valuation Ratio (x)
P/E (on FDEPS)
91.4
88.0
68.9
49.7
42.4
P/CEPS
51.3
67.8
54.1
40.6
34.8
P/BV
12.4
11.5
10.2
8.7
7.5
Dividend yield (%)
0.3
0.3
0.3
0.4
0.4
EV/Sales
6.1
5.9
5.5
4.8
4.1
EV/EBITDA
53.8
57.1
41.6
29.6
25.0
EV / Total Assets
12.2
11.1
9.8
8.3
7.0
Per Share Data ((`)
EPS (Basic)
12.9
13.4
17.2
23.8
27.9
EPS (fully diluted)
12.9
13.4
17.2
23.8
27.9
Cash EPS
23.0
17.4
21.9
29.1
34.0
DPS
3.5
3.5
4.0
4.5
5.0
Book Value
95.0
103.0
116.2
135.5
158.3
Returns (%)
ROCE
16.1
14.5
19.5
24.1
24.3
Angel ROIC (Pre-tax)
22.4
23.9
32.2
41.6
42.5
ROE
13.6
13.0
14.8
17.5
17.6
Turnover ratios (x)
Asset Turnover (Gross Block)
6.3
6.1
5.2
5.2
5.2
Inventory / Sales (days)
103
105
106
107
108
Receivables (days)
11
10
12
13
14
Payables (days)
51
62
57
56
56
Working capital cycle (ex-cash) (days)
63
54
61
64
66
February 13, 2019
7
Bata India Ltd| 3QFY2019 Result Update
Research Team Tel: 022 - 39357800
DISCLAIMER
Angel Broking Limited (hereinafter referred to as “Angel”) is a registered Member of National Stock Exchange of India Limited, Bombay
Stock Exchange Limited and Metropolitan Stock Exchange Limited. It is also registered as a Depository Participant with CDSL and
Portfolio Manager and Investment Adviser with SEBI. It also has registration with AMFI as a Mutual Fund Distributor. Angel Broking
Limited is a registered entity with SEBI for Research Analyst in terms of SEBI (Research Analyst) Regulations, 2014 vide registration
number INH000000164. Angel or its associates has not been debarred/ suspended by SEBI or any other regulatory authority for
accessing /dealing in securities Market. Angel or its associates/analyst has not received any compensation / managed or co-managed
public offering of securities of the company covered by Analyst during the past twelve months.
This document is solely for the personal information of the recipient, and must not be singularly used as the basis of any investment
decision. Nothing in this document should be construed as investment or financial advice. Each recipient of this document should
make such investigations as they deem necessary to arrive at an independent evaluation of an investment in the securities of the
companies referred to in this document (including the merits and risks involved), and should consult their own advisors to determine
the merits and risks of such an investment.
Reports based on technical and derivative analysis center on studying charts of a stock's price movement, outstanding positions and
trading volume, as opposed to focusing on a company's fundamentals and, as such, may not match with a report on a company's
fundamentals. Investors are advised to refer the Fundamental and Technical Research Reports available on our website to evaluate the
contrary view, if any
The information in this document has been printed on the basis of publicly available information, internal data and other reliable
sources believed to be true, but we do not represent that it is accurate or complete and it should not be relied on as such, as this
document is for general guidance only. Angel Broking Limited or any of its affiliates/ group companies shall not be in any way
responsible for any loss or damage that may arise to any person from any inadvertent error in the information contained in this report.
Angel Broking Limited has not independently verified all the information contained within this document. Accordingly, we cannot testify,
nor make any representation or warranty, express or implied, to the accuracy, contents or data contained within this document. While
Angel Broking Limited endeavors to update on a reasonable basis the information discussed in this material, there may be regulatory,
compliance, or other reasons that prevent us from doing so.
This document is being supplied to you solely for your information, and its contents, information or data may not be reproduced,
redistributed or passed on, directly or indirectly.
Neither Angel Broking Limited, nor its directors, employees or affiliates shall be liable for any loss or damage that may arise from or in
connection with the use of this information.
Disclosure of Interest Statement
Bata India
1. Financial interest of research analyst or Angel or his Associate or his relative
No
2. Ownership of 1% or more of the stock by research analyst or Angel or associates or relatives
No
3. Served as an officer, director or employee of the company covered under Research
No
4. Broking relationship with company covered under Research
No
Ratings (Returns):
Buy (> 15%)
Accumulate (5% to 15%)
Neutral (-5 to 5%)
Reduce (-5% to -15%)
Sell (< -15%)
February 13, 2019
8